Data Platform and Data Science

26 December 2009

The Unpopular SELECT Statement

Filed under: Analysis Services — Vincent Rainardi @ 8:00 pm

Most of us are familiar with the SELECT statements to query a table but not many knows how to use SELECT statements to query a cube. Some of us have spent thousands of hours SELECT-ing data from tables but never done any SELECT on a cube, not even for a minute. So the purpose of this article to provide a hands-on experience querying a cube using MDX SELECT statements.

In the next 10 minutes we will:
1. Understand why it is important for us to know how to query a cube
2. Understand what a cube is
3. Create a cube by restoring from backup
4. Review the cube structure
5. SELECT the data from the cube

OK. Let’s start.

1. Why is it important for a SQL Server developer or DBA to understand how to query a cube using MDX?

Because more and more data is stored in cubes. We (SQL Server people) are lucky that Analysis Services is the most popular OLAP tool in the market with 31% market share in 2006, according to The OLAP Report. Analysis Services market share is growing every year. And with Analysis Services bundled up into SQL Server, a new world is open to us, providing us with opportunity to move across from the relational world to the OLAP world. MDX is the defacto standard language in the OLAP world, not only for Analysis Services, but also for Hyperion Essbase, another very popular OLAP tool.

Having OLAP skills could means better job opportunities. If you are a SQL Server DBA, and you are capable of administering both database server and OLAP server then you have the leisure of choosing the jobs that require either of those 2 skills, or both. If you are a SQL Server developer, here in the UK the job market for Analysis Services developers is smaller than SQL Server database developers and the average salary is higher, according to ITJobsWatch, a widely used web site for salaries of UK IT jobs. Analysis Services is £44k with 738 jobs in the last 3 months, compared to £39k for SQL Server developer with 1041 jos. How’s there in the US and Asia? Other countries? I welcome your comments.

2. What is a cube?

As I explain in my book Building A Data Warehouse: With Examples in SQL Server, a cube is a form of database where the data is stored in cells and the position of each cell is defined by a number of hierarchical variables called dimensions. Each cell represent a business event, and the value of the dimensions shows when, where and how this event happened. Actually the term ‘cube’ is technically incorrect because mathematically a ‘cube’ is a 3D shape with 6 identical faces with each face being a square. The correct term is ‘Multidimensional Database’. But since ‘cube’ is easier to understand and widely used in the field (especially in Analysis Services), for the purpose of this article I’ll use the term ‘cube’.

Figure 1 shows a Sales cube for retail industry with 3 dimensions: product, date and store. Each cell in the cube represents the event of an item going through checkout. The position of each cell is defined by the value of the dimensions. Each cell contains 3 numbers: quantity, sales amount and sales cost.

Figure 1. A sales cube with 3 dimensions

3. Create a cube by restoring from backup

One of the main reasons why we never done SELECT from a cube is because we don’t have a cube. There may be lots of tables around you but there is no single cube. So let’s create the cube shown in Figure 1.

Backup of an Analysis Services database: Sales.abf (see the download in the Resources section below) (176 KB)

Download the above backup file and follow these steps to restore the cube. For this exercise you need SQL Server 2005 or 2008, with Analysis Services installed.

  1. Make sure that SQL Server Analysis Services is running. If not, start it in the SQL Server Configuration Manager.
  2. Open SQL Server Management Studio, connect to your Analysis Services instance.
  3. On the Object Explorer, expand the Analysis Services instance by clicking + to the left of it, right click the Databases folder and choose Restore… as shown in Figure 2.

    Figure 2. Restoring an Analysis Services database
  4. On the Restore Database window, type Sales as the Restore database and click Browse… to select the Sales.abf that you downloaded as shown in Figure 3 and click on OK.

    Figure 3. Restore Database window
  5. On the Object Explorer, right click on the Database folder again and click on Refresh. You will now see the Sales database that you just restored on the Object Explorer.

4. Review The Cube Structure

Before we do the SELECT statement, let’s familiar ourselves with the Sales cube we have just restored. This is done by browsing the cube.

  1. Expand Analysis Services instance by clicking + sign, expand the Databases folder, expand the Sales database, expand the Cubes folder, right click on the Sales cube and choose Browse as shown in Figure 4.

    Figure 4. Opening the cube browser
  2. SSAS cube browser opens. Close Object Explorer pane and expand date, product and store dimension by clicking on their + sign. It looks like Figure 5 below.

    Figure 5. Browsing a cube
  3. Let’s drag Sales Amount to Drop Totals or Detail Fields Here, drag Month to Drop Row Fields Here, drag Product Category to the Select dimension area and set it to “Book“. The result is shown on Figure 6 below.

    Figure 6. Monthly sales amount for Book products
  4. We can see that the cube has 3 measures and 3 dimensions, and we know the attributes of those dimensions. Please feel free to explore the cube further by changing the dimension attributes on the row, column and filter areas to get yourself familiar with the cube.

5. SELECT The Data From The Cube

Now that we know cube structure, we are ready to select data from the cube.

  1. On the toolbar, click on the MDX icon (it’s the 3rd icon from the left) and click Connect to connect to your Analysis Services instance.
  2. Close the Object Browser if it’s open so you have wider area to write your query.
  3. Select Sales database on the drop down list as shown on Figure 7.

    Figure 7. Choosing Analysis Services database
  4. On the empty space on the right hand side, type the following MDX statement and click on Execute (or press F5).
    select {[Measures].[Sales Amount]} on columns,
    {[Date].[Month].members} on rows
    from sales
    where [Product].[Product Category].&[Book]
    Listing 1. Basic MDX statement
  5. The query output is shown in Figure 8 below.

    Figure 8. Query output
  6. Please take a moment to look at the basic MDX statement on Listing 1 above. Sales Amount is on the column, Month is on the row and Product Category is on the where clause. We say that Sales Amount and Month are on the query axis and Product Category is on the slicer axis. To put it simply, query axis means SELECT clause; where as slicer axis means the WHERE clause.
    Please familiar yourself with this basic syntax of MDX by changing the query on listing 1 a little bit. For example:

    • Change [Month] to [Year] or to [Date]
    • Swap Month and Sales Amount: [Date].[Month].members on the columns and [Measures].[Sales Amount] on the rows
    • Remove the where clause
    • Swap Product Category and Month: “… {[Product].[Product Category].members} on rows where [Date].[Month].&[December]”
    • Remove the “on columns” clause: “select {} on columns, {[Date].[Month].members} on rows … ”
  7. The result on figure 8 displays empty tuples (tuple means cube cell). To filter the empty tuple, add “non empty” like this:
    select {[Measures].[Sales Amount]} on columns,
    non empty {[Date].[Month].members} on rows
    from sales
    where [Product].[Product Category].&[Book]

With that, we have achieved the purpose of this article: to provide a hands-on experience querying a cube using MDX SELECT statements. I hope this exercise had enriched your knowledge horizon.

You might ask “why do we have to select from the cube if we can browse it?”. It’s a good question. The best way to explore an Analysis Services cube is using a cube browsing tool. The cube browser in Analysis Services 2000 was not so user friendly, but in Analysis Services 2005 Microsoft had done a good job improving it. The SSAS cube browser is now very easy to use. To make it even more user friendly in terms of drilling down, up, across and analysing data, people use third party tools. One of the most popular tool for browing Analysis Services cubes is ProClarity, which is now owned by Microsoft.

So why do we need to understand how to SELECT data from a cube? Because we need to define custom calculation such as custom measure, default member, Key Performance Indicators, etc. Yes we can survive in todays’ Analysis Services world without knowing MDX, but sooner or later we will come across it. There will come the time where we need to create derived attribute or measure in our cube and we need to use MDX. Also when we need to import the content of a cube into a table for reconciliation purposes.

Lucky for us who uses SQL Server Reporting Services, that we can visually compose the MDX SELECT statements in Business Intelligence Development Studio. SSRS 2005 has a build-in tool called MDX Query Designer which allow us to use drag and drop approach to compose the MDX query when building the data set for the report. I explained how to use this tool and how to build a report querying data from Analysis Services cubes in the Chapter 12 of my book, Building A Data Warehouse: With Examples in SQL Server. But sometimes we are not so lucky, for example where the company or client we work for uses SQL Server 2005 only as a database engine but they use Business Object or Cognos for their reporting tool, rather than Reporting Services.

In the Resources section below I include the DDL script, the Data Population Script, the cube creation XMLA and the SSAS Solution if you want to check any details or want to develop/play a bit more with the cube. So you can recreate the database by executing the DDL and populate the database. When opening the SSAS solution you need to change the data source to point to your SQL Server. The XMLA is for recreating the cube (empty) directly on the SSAS server.

Thank you for reading. As usual I welcome any comments and feedback.

Vincent Rainardi
21th December 2007
Author of Building a Data Warehouse: With Examples in SQL Server

Resources: Data Population.sqlDDL.sqlsales.abfsales.xmlaSSAS Solution.zip
To download the file, click on 1 of the 5 links above, then click Download.

This is a repost from SQL Server Central

23 December 2009

Select count(*) For A Very Big Table

Filed under: Data Warehousing,SQL Server — Vincent Rainardi @ 10:08 pm

select count(*) can take 1 minute if the table has millions of rows with no indexes*. This is because SQL Server does table scan. An example of this situation is a stage table for the fact table in the data warehouse. We don’t index the table because we read the data in its entirity.

To avoid table scan when counting the rows on tables without index, read the row_count column from sys.dm_db_partition_stats. This DMV contains the row count information for each partition in the database. And page count too. For example:

select ps.row_count from sys.dm_db_partition_stats ps
join sys.tables t on ps.object_id = t.object_id
where t.name = ‘TableName’ and ps.index_id in (0,1)

Notes: (there are always notes to everything eh 🙂 )

  1. The (0,1): for heap it’s 0, for clustered-indexed table it’s 1. If a table has more than 1 index, the row_count column are the same for all indexes (well it has to be!), so we just take index_id 0 or 1.
  2. If table is partitioned we will have several rows on this DMV for index_id 0 or 1. Each row has different partition_number. So we need to sum the row_count like this:

select sum(ps.row_count) from sys.dm_db_partition_stats ps
join sys.tables t on ps.object_id = t.object_id
where t.name = ‘TableName’ and ps.index_id in (0,1)

A 10 millions staging table could take 1 minute if we do select count(*) from TableName, but with sys.dm_db_partition_stats it only takes 1 second. It’s quite handy for data warehousing where we deal with large stage tables.

In SQL 2000 row count is in sysindex and in 2005 & 2008 this is still available:

select i.rowcnt from sysindexes i
join sys.tables t on t.object_id = i.id
where t.name = ‘TableName’ and indid in (0,1)

Notes (told you there is always a note to everything 🙂 )

  1. Notice there are no . on sysindex but there is a . on sys.tables. In SQL 2000 we had sysindex and sysobjects. In 2005 & 2008 practically speaking sysindexes is replaced by sys.indexes, and sysobjects is replaced by sys.tables, sys.views, sys.procedures and others (sys.key_contstraints, sys.foreign_keys etc). Well,  not exactly ‘replaced’, as the old views are still available.
  2. Using sysindexes we don’t have to worry about partitions. Whether the table is partitioned or not there is only 1 row having indid 0 or 1.

*Lots of people think that a heap is a table without any index. No, a heap is a table without a clustered index. So a heap can have a non-clustered index. If a table don’t have an index, is it a heap? Yes. Because if the table doesn’t have any index, that means it doesn’t have a clustered index. But I can not write the title of this article as “select count(*) is slow on heaps” because select count(*) is fast on a heap that has a non-clustered index.

21 December 2009

SSAS DMV Nugget at SQL Server User Group

Filed under: Analysis Services,Event — Vincent Rainardi @ 9:58 pm
Tags: ,

On 10th June I presented a 10 minute nugget about SSAS DMV at the SQL Server User Group event at Microsoft TVP. Andrew Fryer presented 2008 R2 and Gemini and Ashwani Roy presented SSAS and MDX Studio. Sybase presented Information Architecture. Details of the event below.

This is the DMV scripts I used that evening:

select * from $system.dbschema_tables –where table_catalog = ‘AW’
select * from $system.dbschema_columns –where table_catalog = ‘AW’
select * from $system.dbschema_catalogs
select * from $system.mdschema_cubes
select * from $system.mdschema_hierarchies
select * from AW.[$Dim Product].[$Dim Product] –database dimension
select * from AW.[Sales].[$Dim Product] –cube dimension
select * from AW.[Sales].[Fact Sales] –cube
select * from AW.[$Dim Product].[Dim ProductMG] –dimension cube (1 dim no measure)
select * from $system.mdschema_members where cube_name = ‘$Dim Product’ and [dimension_unique_name] = ‘[Dim Product]’ and [hierarchy_unique_name] = ‘[Dim Product].[Color]’
select * from AW.[$Dim Product].[$Dim Product] where Color = ‘Black’ or Color = ‘Silver’ –no LIKE,<>,in,JOIN
select distinct Color from AW.[Sales].[$Dim Product]
select * from $system.discover_commands
select * from $system.discover_connections
select * from $system.discover_memoryusage
select * from $system.discover_object_memory_usage
select * from $system.discover_object_activity where object_reads > 0
select * from $system.discover_partition_stat
select * from systemrestrictschema($system.discover_partition_stat, CUBE_NAME = ‘Sales’, DATABASE_NAME = ‘AW’, MEASURE_GROUP_NAME = ‘Fact Sales’, PARTITION_NAME = ‘Fact Sales’)
select * from $system.discover_partition_stat
select * from systemrestrictschema($system.discover_dimension_stat,DIMENSION_NAME = ‘Dim Product’, DATABASE_NAME = ‘AW’)
select * from systemrestrictschema($system.discover_performance_counters, PERF_COUNTER_NAME = ‘\MSAS 2008:Connection\Current connections’,PERF_COUNTER_NAME = ‘\MSAS 2008:MDX\Total Cells Calculated’)

An example of discover schema rowset XMLA for comparison with DMV (DMV is so much easier isn’t?)
<Body>
<Discover xmlns =”urn:schemas-microsoft-com:xml-analysis”>
<RequestType>MDSCHEMA_CUBES</RequestType>
<Restrictions>
<RestrictionList>
<CATALOG_NAME>AW</CATALOG_NAME>
<CUBE_NAME>Sales</CUBE_NAME>
</RestrictionList>
</Restrictions>
<Properties>
<PropertyList>
<Catalog>AW</Catalog>
</PropertyList>
</Properties>
</Discover>
</Body>
</Envelope>
<!–Discover
( in RequestType as EnumString,
in Restrictions as Array,
in Properties as Array,
out Resultset as Rowset
)–>
And this is the script to create the linked server, and putting the DMV output into a table using select into to enable other T-SQL predicates such as ‘like’.
The idea with putting the DMV output into a table is so that we cancombine SSAS DMV with SSAS OlapQueryLog. We can then create a data warehouse (fact and dimension tables) from these tables, then we can build a cube on top of that data warehouse.
use SSASQueryLog
select * from QueryLog

exec master.dbo.sp_addlinkedserver @server=’SSAS’, @srvproduct=N”,
@provider=’MSOLAP’, @datasrc=’VIVA2′, @catalog=’AW’
select * from OpenQuery(SSAS, ‘select [Measures].[Order Quantity] on columns from [Sales]’)
select * from OpenQuery(SSAS, ‘select * from $system.discover_connections’)
select * from OpenQuery(SSAS,’select * from systemrestrictschema($system.discover_performance_counters, PERF_COUNTER_NAME = ”\MSAS 2008:Connection\Current connections”,
PERF_COUNTER_NAME = ”\MSAS 2008:MDX\Total Cells Calculated”)’)
–create/insert into table:
select * into Object_Activity from OpenQuery
(SSAS,’select * from $system.discover_object_activity’)
select * from Object_Activity where Object_Parent_Path like ‘%.AW.%’ and Object_Reads > 0 –like

select * into Object_Memory_Usage from OpenQuery
(SSAS,’select * from $system.discover_object_memory_usage’)
select * from Object_Memory_Usage –where Object_Parent_Path like ‘%.AW.%’

select * into Memory_Usage from OpenQuery
(SSAS,’select * from $system.discover_memoryusage’)
select * from Memory_Usage –where ObjectParentPath like ‘%.AW.%’

Details of the event

Evening Meeting on Wed Jun 10, 2009 in READING
SQL 2008 R2 and Gemini; From Data Modelling to Information Architecture and Attribute Relationships, Aggregations and using MDX Studio to its best
Organiser: UK SQL Server User Group
Address: Building 3, Microsoft Campus, Thames Valley Park, Reading, RG6 1WG
Agenda:
5.30pm – 6:00 Registration and networking + Tea/Coffee with biscuits.
Meet and greet.
6:00pm – 6:15pm Round Table discussion and Nuggets – ALL
Take stock and get the latest news in the SQL Server field. This is also a great opportunity to ask any burning questions you have, may be a problem at work.
It’s also a great opportunity to share your knowledge and gain exposure in the industry by giving a short 1 – 6 minute “nugget” demo/tip.
6.15pm – 7:00pm Andrew Fryer, Microsoft
SQL Server 2008 R2 and Gemini
SQL Server 2008 R2 will be the release with Gemini in it. Gemini is about trying to marry self service BI for end users with proper control of that data for the IT Professional. The beta program has only been recently announced and so it’s still early days but if you want to know what to expect then this is your first real opportunity in the UK. So join Andrew Fryer for an hour of peering into what 2010 BI looks like
7:00pm – 7:45pm Ruairi Prendiville, Sybase

From Data Modeling to Information Architecture

It used to be about doing the thing right: a tactical approach for data modelling was necessary, because all the data was contained within the same domain. Now it’s about doing the right thing. Management demands information that is strategic and which helps them make business decisions. This information is more complex, housed in multiple domains, created in different languages, and used by different areas of the organisation for opposing purposes. Adding to the complexity is the critical need for it to be timely, accurate and comprehensive.
In this 45-minute session, Andrew de Rozairo and Alex Pratt of Sybase will impart the secrets of successfully building a foundation for a comprehensive and successful information architecture. You’ll learn how to take a new approach to modelling: combining the business view, information view and the technology view to achieve a strategic vision.
7:45pm – 8pm BREAK: Light refreshments
More time to network and ask questions…
8pm – 8:15pm Vincent Rainardi
Nugget (demo) on SSAS
8:15pm – 9.00pm Ashwani Roy
Attribute Relationships, Aggregations and using MDX Studio to its best
Setting proper relationships for the attributes of a dimension is essential from a query performance point of view. It is one of the most important things while dimensional modelling.
Aggregations are pre calculated summaries of cube data that help enable Microsoft SQL Server 2005 Analysis Services (SSAS) to provide rapid query responses. Aggregations are like fact table data grouped and aggregated to a higher level in the Hierarchy. Building the correct aggregations can greatly enhance query performance.
MDX Studio can be used to analyze complex MDX expressions, monitor performance characteristics of MDX queries and get insight into how MDX interacts with other UDM features such as attribute relationships. MDX Studio provides unique visualization representation of MDX expression and allows the user to interact with different stages of MDX execution. It is built by Mosha Pasumansky, who is inventor of MDX and one of the Architects of Microsoft Analysis Services.

19 December 2009

Where To Put an Attribute (DW)

Filed under: Data Warehousing — Vincent Rainardi @ 9:59 pm
Tags:

When designing a data warehouse, sometimes we need to decide whether to put an attribute(s) in its own dimension, or in an existing dimension. That is, if you have a fact table with dim1_key on it, you need to decide whether to put this new attribute(s) on dim1 or create a new dim2.

In travel or airline industry, you could have a ‘ticket’ dimension and put all the ticket details on it. In insurance, you could have a policy dimension and put all policy details on it. In retail banking, we could have an account dimension and put all the account details on it. In telecom industry, we could have call dimension and put all the call details on it. In health care, we could have a dimension called ‘case’ and put all the case detail on it. In investment banking, we could have a dimension called Transaction, and put all the transaction details on it. This concept is the same as creating an order dimension in the retail or ecommerce industry. It’s like a large dimension, which should be split into several dimensions.

In banking, a group consists of several companies, and each company can have several accounts. We are not going to put the companies details into account dimension, are we? We are going to put the companies details into customer dimension. But, are we going to split company and group into separate dimensions? In telecom,

In some cases, it is a decision whether we snowflake or keep it as a star. Which is easy to decide, as that depends on your style/principle of warehousing. But in some cases, it’s not a case of snowflaking. In snowflake, dim2 is linked to the fact table through dim1. But in many of the cases above, it is about whether we have dim1 & dim2 both linked to the fact table, or combine them into 1 dim (with lower grain).

It’s not a matter of fact table grain either, i.e. whether we can split the measure into several rows based on those dim2 attributes. Because we know that (for example) the grain of the fact table is dim1, dim2, dim3, dim4. But for analysis purpose, we could split dim4 into 2 dims. We could put say 3 attributes of dim4 into dim5. The grain of the fact table is still dim1, dim2, dim3, dim4. Dim 5 does not affect the measure. If the value of measure1 on a fact row is 100, after we split dim4 it will still be 100. The fact that there are 5 dim keys in the fact table doesn’t mean that the grain of the fact table is those 5 dims. No. In many cases, the number of the dim keys on the fact table is more than the ‘grain keys’.

In these cases, the question we should ask myself when deciding is: can those dim2 attributes change without dim1 attributes changing? If they can, then they should be in a separate dimension.

16 December 2009

Date Dimension in Analysis Services (part 2)

Filed under: Analysis Services,Data Warehousing — Vincent Rainardi @ 9:58 pm
Tags:

This is the second and last part of the date dimension series. In the first article we discussed how we can add the same dimension into the same cube several times as different names (role play dimension), the advantages and disadvantages of creating several named queries from the same date dimension table, the considerations around the unknown member in the date dimension, and the date hierarchies.

In this article we will discuss:

  1. A date dimension that is used as a reference dimension
  2. A date dimension that is generated and stored on the SSAS server (no physical table)
  3. Advantages and disadvantages of using smart date key e.g. YYYYMMDD
  4. Enabling users to select a date (or month) to be used in calculated measure using ‘from date’ and ‘to date’
  5. Other topics about date dimension in SSAS

1. Reference Date Dimension

In Figure 1 below, Dim1 and Dim2 are normal dimensions, they are connected to the fact table directly. Dim3 on the other hand, is connected to the fact table through Dim2. In SSAS, a dimension which is connected to the fact table through another dimension is called ‘Reference Dimension’.

Figure 1. A Reference Dimension connects to the fact table through another dimension

The dimension that connects a reference dimension to the fact table is called ‘Intermediate Dimension’. Dim2 in Figure 1 above is an intermediate dimension. The purpose of creating a reference dimension is to expand an attribute in the intermediate dimension so that we can analyze using many attributes in the reference dimension. For example, suppose we have a product dimension table that has a release date column, as shown in Figure 2 below. This column indicates when the product was released into the market. We also have a date dimension table, which has date, month and year columns. Using the date dimension as a reference dimension, we can analyse the release date attribute by year, month and date attributes.

Figure 2. Expanding the Release Date attribute into year, month and date attributes using a reference date dimension

As with everything else, we need to understand the advantages and disadvantages (both sides), and the alternatives. To expand a single date attribute into several date attributes (such as year, month, day, etc), we have 2 options:

  • Option 1. Do it in the original dimension
  • Option 2. Using a reference date dimension

To do option 1, we need to create Release Year, Release Month and Release Date attributes on the Product dimension. We can create these attributes by modifying the SQL SELECT statement on the Data Source View (DSV). For example, rather than selecting only 1 column like this:
SELECT ...,Release_Date,... FROM Dim_Product
we select 3 columns like this:
SELECT ...,left(convert(varchar, Release_Date, 20), 10) as Release_Date, left(convert(varchar, Release_Date, 20), 7) as Release_Month, datename(yy, Release_Date) as Release_Year,... FROM Dim_Product

To do option 2, on the cube’s Dimension Usage tab we link the Release Date Key attribute on the Product dimension to the Date dimension, as shown in Figure 3 below.

Figure 3. Setting up a Reference Dimension on the Dimensional Usage tab

On option 1 above, the 3 attributes of Release Date will appear under Product Dimension, and only contain the values that exist in the Product dimension’s Release Date column. For example, if the Product dimension table does not contain any row with Release Date in January 2001 then the Release Month attribute will not have ‘January 2001’ member.

On option 2 above, we will have a new dimension called Release Date dimension. This dimension will have the complete set of dates, months and years. There are no missing members like in option 1.

So there are 2 advantages of using a reference dimension:

  1. We can derive other attributes from a single attribute
  2. We have complete set of members

There is another advantage of using a reference dimension: consistency of attributes. Let’s say that in the product dimension we have Release Date and Expiry Date. And in the customer dimension we have Registered Date and Leaving Date. For each of these 4 date attributes we want to analyze by: year, quarter, month, week and date. By creating 4 reference dimensions from the same date dimension, we will have a consistent set of attributes, i.e. all 4 dimensions will have the same 5 attributes.

The disadvantage of using a reference dimension is that we can potentially have many additional date dimensions. In the case of Release Date, Expiry Date, Registered Date and Leaving Date that I mentioned in the previous paragraph, we will have 4 additional date dimensions. Having too many date dimensions could potentially lower the cube’s user friendliness. When we say ‘too many’ or ‘too much’, we need to provide a guide about how much is too much. From my experience 6 date dimensions are too many, where as 3 date dimensions are OK.

So, how do we create a reference date dimension? Let’s use the scenario shown in Figure 2 above. First, we need to create a date dimension containing the attributes that we need (year, month, date) attributes and the date key. Then, we add this date dimension to the cube and call it ‘Release Date’, as shown in Figure 3 above. Then, on the cell where the Release Date dimension intersect with the measure group, we click on the … button and define the relationship as shown in Figure 4 below:

Figure 4. The referenced relationship on Release Date dimension

One of the major considerations when creating a reference date dimension is the date key. Please refer to figure 1 again. The intermediate dimension usually has a date attribute with date type datetime (such as 2009-01-15 00:00:00.000) or varchar (such as ‘2009-01-15’). Or, in SQL Server 2008, date data type. Where as the reference date dimension may have surrogate key of data type integer (0, 1, 2, 3, …). So how do we link them if they have different data types?

There are 3 ways:

  1. Change both of them to surrogate key, e.g. 0, 1, 2, 3, …
  2. Change both of them to datetime, e.g. ‘2009-01-15 00:00:00.000’
  3. Change both of them to smart date key, e.g. 20081130

Option 1. The advantage of using surrogate key is consistency, i.e. all the dimension keys in the data warehouse are surrogate keys (meaningless incremental integer) and the reference date dimension is no exception. The disadvantages are slightly longer development time and slightly longer cube processing time. This is because we need to lookup the surrogate key. In the case shown in Figure 2, to change the release date column on the product dimension table to release date key, we need to join the table with the date dimension table to get the surrogate key. This is done on the product dimension named query on the data source view (DSV).

Option 2. Using datetime data type as the date key is beneficial when the original date attribute is already in datetime data type. In the case shown in Figure 2, if the release date column on the product dimension is already in datetime data type, we don’t need to change anything on the product dimension named query. Every date dimension table has a date column with the datetime data type, so it is straight forward to create a named query that retrieves that column as the primary key.

Option 3. If there is a consensus that through out the data warehouse, all date dimensions use smart date key, then for consistency we need to use smart date key for reference date dimension. I explained the advantages of using smart date key in SSAS in section 3 of this article.

Questions that are quite often asked with regards to reference date dimensions are:

  • For the date key, which of the above 3 options is the best one?
    It depends on your situation. I have explained the considerations above. Everything else being equal I prefer option 3 provided that a) the SSAS measure groups are partitioned based on date key, and b) the relational fact tables are physically partitioned based on date key. If the date key is not used for partitioning, I prefer to use surrogate key (option 1).
  • Is reference dimension not snowflaking? If so, is it bad?
    Yes it is snowflaking. On the relational data warehousing, I always prefer star schema than snowflake, but in this case (only on SSAS) reference dimension has its advantages, i.e. ability to analyze by many date attributes and providing a complete set of members. So reference date dimension is good, as long as it’s not too much (see the disadvantage of having too many reference date dimensions that I described earlier).
  • What is “materialize” in Figure 4? Do we need to use it?
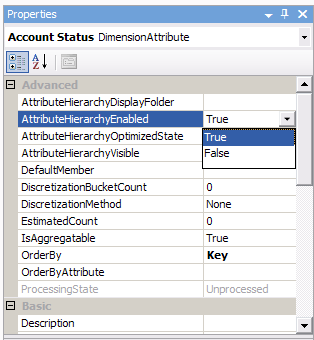
    Materialize means that the attributes of the reference dimension (Dim3 in Figure 1) are physically stored in the intermediary dimension (Dim2 in Figure 1), thus improving query performance. Yes, use it by all means. The disadvantage (there are always 2 sides of a coin and we need to see both sides before deciding) is slightly more cube processing time. In the case of reference date dimensions the additional processing time is minimal because they only have tens of thousands members (18,262 members for 50 years). When we say “minimal” or “low” we need to clarify “how low is low”. In my experience the additional cube processing time for a materialized reference date dimension is under a second.

2. Server Date Dimension

Server date dimension is a date dimension that is generated by SSAS and stored internally within SSAS. Unlike a normal date dimension, a server date dimension is not created from a physical date dimension table in the data warehouse. In SSAS, server date dimension is also known as ‘server time dimension’. I prefer to differentiate ‘time dimensions’ i.e. hours, minutes, seconds, from ‘date dimensions’ i.e. year, quarter, month, week, date, so in this article I will use the term ‘server date dimension’.

The benefit of using server dimension is that we can have date functionalities without having a physical date dimension table. Practically this usually happens on situations where we don’t have access to create a date dimension table in the database or because we don’t want to. For example the database may be part of an off-the-shelf application. Or perhaps the database (from which we build the cube) is an Online Transaction Processing (OLTP) database, not a data warehouse. Yes, cubes are also created from 3rd normal form databases such as Operational Data Store (ODS) and OLTP, not only from denormalized, dimensional data warehouse databases.

The other benefit of having a server date dimension is that we can have various attributes and hierarchies without having to create and populate them. For example: manufacturing calendar, fiscal calendar, ISO 8601 calendar and reporting/marketing calendar. Let’s briefly go through what they are.

  • A regular calendar consists of 12 months and 52 weeks, starts on 1st January.
  • A fiscal calendar consists of 12 months and 52 weeks, can start on any date.
  • A reporting/marketing calendar consists of 4 quarters with 3 months each. The number of weeks in each of these 3 months can be 4 weeks in the 1st month, 4 weeks in 2nd month, 5 weeks in 3rd month (445 for short), or 454, or 544.
  • A manufacturing calendar consists of 3 quarters with 3 periods each and 1 quarter with 4 periods. Each period consists of 4 weeks. There are 13 periods and 52 weeks in a year.
  • An ISO 8601 calendar consists of 52 weeks with no months or periods.

The disadvantage of having a server date dimension is inflexibility, i.e. we can’t add other attributes, such as special date flag, end of month flag, bank holiday flag, promotion period indicator, etc. We can’t change the format in server date dimension. For example, in the fiscal calendar, the year, quarter, month and date attributes are shown in Figure 5 (I use Excel 2007 here to browse the cube). We can’t change the year to ‘FY 2009’, or the month to ‘Jan 09’, or the date to ‘1/24/2009’.

Figure 5. Attribute names in server date dimension fiscal calendar

To build a server date dimension, right click on Dimensions on Solution Explorer and choose new dimension, click on Next, choose ‘Generate a time table on the server’, click on Next, specify the first and last calendar days, the first day of the week, the time periods and the language for member names, as shown in Figure 6 below.

Figure 6. Specifying time periods

Click on Next, choose which calendars you want to create, and specify their details such as ‘Start week and month’, ‘Week by month pattern’ and ‘Quarter with extra periods’, as shown in Figure 7 below.

Figure 7. Specifying the calendars and their details

Click on Next, give a name for the date dimension and click on Finish.

3. Smart Date Key

As Ralph Kimball and his group consistently suggested for many years, in dimensional data warehousing the primary keys of dimension tables should be surrogate keys. Surrogate keys means a meaningless sequential integer (e.g. 0, 1, 2, 3, …). I agree with this opinion. There are 3 main advantages of using surrogate keys:

  1. To make the data warehouse more flexible to cope with changes in natural key
  2. To enable the data warehouse to capture history using Slowly Changing Dimension type 2
  3. To enable the data warehouse to deal with ‘unknown’, ‘not applicable’ and ‘late arriving’ dimension rows

An additional advantage of using surrogate key is query performance (because the joins are on single column integer primary keys).

The alternatives to surrogate keys are using natural keys, or using smart keys. Natural keys are the primary keys of the tables in the source systems. For customer dimension, the natural key is customer ID. For account dimension, the natural key is account number. Date dimension does not have a natural key as there is no source table for it. Even though it doesn’t have a source table, we can say that the natural key of a date dimension is the date in date or datetime data type, such as ‘2009-01-15 00:00:00.000’ in SQL Server 2005 (and 2000) datetime data type, or ‘2009-01-15’ in SQL Server 2008 date data type.

Smart key is an integer or character primary key that has a meaning. Each character in the key indicates something. Smart keys are often in the form of concatenation of several items. For product dimension, an example of smart key is Category (2 chars) + Year Launch (YY) + Sequence (3 digits) + Suffix (2 chars), e.g. HC08305FG. For trip (journey) dimension, a possible smart key is Destination-Origin-DepartureDate-Sequence, e.g. HPC-HAC-090115-01. For gas pump (in a gas station), a possible smart key is StationNumber-PumpNumber, e.g. 506-03 (similar technique is applicable for checkout/till dimension in supermarkets). In the case of date dimension, a popular smart key is is YYYYMMDD in integer data type, e.g. 20090115 for January 15th 2009

For relational data warehousing, using surrogate keys is better than using natural keys or smart keys. For date dimension in SSAS (and this is only applicable for date dimension – it’s not applicable for any other dimensions), there are 2 advantages of using smart date keys:

  • Easier to use the date dimension as a reference dimension, as we don’t need to do a look up to translate the dates in the intermediate dimension into the keys.
  • Easier to partition the measure group based on the date. To partition a measure group in SSAS, we need to specify a query for each partition. The query is the same for all partitions, except that in the where clause we have an additional condition for partitioning. If we have smart date keys on the fact table, we can use it for this partitioning condition on the where clause. For example, if we allocate each partition to cover a quarter, the additional partitioning condition can be: “where transaction_date_key between 20090101 and 20090331”.

How about unknown dates? Unknown dates is handled using unknown member. This is another advantage of using smart date key: unknown dates are not mapped to 01/01/1900, but mapped to the unknown member of the date dimension. This way, in the cube we won’t have an awkward year such as 1900, which originated from the unknown row.

4. From Date and To Date

Sometimes, the fact table from which we build the cube from is not transactional. It may contain the balance instead, like this fact_account_balance table:

Snapshot Month Key Account Key Other Dim Keys Account Balance
200809 1 120
200809 2 750
200810 1 120
200810 2 880
200811 1 300
200811 2 880

Table 1. Account Balance fact table

In this case, let’s assume that the Snapshot Month dimension and Account dimension are like these:

Snapshot Month Key Snapshot Month
200809 September 2008
200810 October 2008
200811 November 2008

Table 2. Snapshot Month dimension table (or view)

Account Key Account Number
1 10001
2 10002
3 10003

Table 3. Account dimension table

The above fact table contains the snapshot of the balance of each account every month. So, accordingly, we build a cube showing the balance of each account for every snapshot month.

If the users want to know the transaction amount between two particular months, we will need to create a calculated measure that calculates the difference, like this:
([Snapshot Month].[Snapshot Month].&[200811],[Measures].[Balance])-
([Snapshot Month].[Snapshot Month].&[200809],[Measures].[Balance])

But the problem is, we don’t know the value of the two months that the users want until run time. For this situation we can create 2 month dimensions that the user can select. Let’s call them ‘Month From’ and ‘Month To’.

The Month From and Month To dimensions are created from the Snapshot Month table (or view). Add both Month From and Month To dimensions to the cube. On the Dimension Usage tab of the cube, do not connect them to the measure group. Leave the Relation Type dropdown list to ‘No Relationship’, as shown in Figure 8 below. This way, users will be able to select a member of Month From and Month To dimension, without affecting any measures.

Figure 8. Configuring a dimension for user selection

Then we can create a calculated measure that calculates the difference of balance between Month From and Month To, like this:
(StrToMember("[Snapshot Month].[Snapshot Month].&" +
Right(MemberToStr([Month To].[Month To].CurrentMember),8)),
[Measures].[Account Balance])-
(StrToMember("[Snapshot Month].[Snapshot Month].&" +
Right(MemberToStr([Month From].[Month From].CurrentMember),8)),
[Measures].[Account Balance])

The “right(…,8)” function varies depending on the format of the Month From and Month To dimension. The above MDX assumes that the format is [200809] so the MemberToStr function returns “[Month From].[Month From].&[200809]”, hence we take the right most 8 characters.

To get the difference of balance between two particular months, the users can select a member on the Month From and Month To dimensions on the slicer axis, put Account Number on the row and put the calculated measure (called Changed Amount) on the column, as shown on Figure 9 below.

Figure 9. Calculated measure using Month From and Month To dimensions

Or if we use Excel 2007:

Figure 10. Selecting Month From and Month To dimensions using Excel

And on ProClarity it looks like this:

Figure 11. Selecting Month From and Month To dimensions using ProClarity

The above method provides a way to capture user input at run time, i.e. using a date dimension that is not connected to any measure groups. This dimension is used in a calculated measure to select the real date dimension.

5. Other topics about date dimension in SSAS

Among other topics about date dimension in SSAS, by far MDX date functions are the most frequently asked. So in this section, in a limited space, I will try to cover:

  • Today’s date
  • Total until this month
  • Year to date
  • Month to date
  • Last non empty

To get today’s date, we can use Now() function. For example, to specify a member of the month attribute with key = “2009-01”:
Members("[Date Dim].[Month].&[" + Format(Now(), "yyyy-MM") + "]")

To specify a calculated measure that totals a measure from a particular month until this month, we can use “sum((member1:member2),measure)”. For example, to create calculated measure [Total To This Month] that sums up Amount measure from April 2008 until this month:
with member [Measures].[Total To This Month] as
'sum(([Date Dim].[Month].&[2008-04]:
Members("[Date Dim].[Month].&[" + Format(Now(), "yyyy-MM") + "]")
),[Measures].[Amount]
)'
select [Measures].[Total To This Month] on columns,
[Dim2].[Attribute1].[All].Children on rows
from [Cube]

Note: we can use “aggregate” instead of “sum” and “StrToMember” instead of “Members”.

To specify a calculate measure that totals a measure from the beginning of the year until today (year to date), we can use YTD function. For example, to create calculated measure [YTD Amount] that sums up Amount measure from 1st Jan this year until today:
with member [Measures].[YTD Amount] as
'sum(YTD(StrToMember("[Date Dim].[Date].&["+Format(Now(), "yyyy-MM-dd")+"]")),[Measures].[Amount])'
select [Measures].[YTD Amount] on columns,
non empty {[Dim2].[Attribute1].[All].Children} on rows
from [Cube]

YTD(x) returns members from the same level as x, from the first member until x, in the same year. For example, if x is 5th May 2008 then YTD(x) is 1st Jan 2008 to 5th May 2008. If we don’t specify x, SSAS assumes that x is the current member of date dimension (the dimension with dimension type = Time).

To specify a calculated measure that totals a measure from the beginning of the month until today, we can use PeriodsToDate function. For example,
with member [Measures].[MTD Amount] as
'sum(PeriodsToDate([Date].[Month],
StrToMember("[Date Dim].[Date].&["+Format(Now(), "yyyy-MM-dd")+"]")
),[Measures].[Amount])'
select [Measures].[MTD Amount] on columns,
non empty {[Dim2].[Attribute1].[All].Children} on rows
from [Cube]

PeriodsToDate(p,x) returns members from the same level as x, from the first member until x, in period p. For example, if p is Month and x is 5th May 2008, then PeriodsToDate returns the dates from 1 to 5 May 2008. If p is Year and x is August 2008, then PeriodsToDate returns the months from January 2008 to August 2008.

To select the latest date that contains data we can use Tail function:
select Tail(NonEmpty([Date Dim].[Date].Members)).item(0) on columns
from [Cube]

Tail returns a set; to get a member out of the set we can use Item function. To select the latest month that contains data, we can change [Date] in the query above with [Month].

The above query examines the default measure. To examine measures other than the default measure, we can replace “NonEmpty” with “NonEmptyCrossJoin”, like this:
select tail(NonEmptyCrossJoin([Date Dim].[Month].Members * [Measures].[Amount])).item(0).item(0) on columns
from [Cube]

In the above query we use “item(0)” twice because the NonEmptyCrossJoin returns 2 dimensional tuple. The first item(0) returns the measure. The 2nd item(0) returns the month.

Vidas Matelis and Thomas Ivarsson, two renown experts in SSAS, provide a handy page that shows how date-related MDX functions are practically used. It contains useful things like: list of months up to a specified month, ordering date dimension members in descending order and getting the first day of the last month in the cube.

So, together with the first part, in this article we have discussed: role play date dimension, multiple named queries, unknown member, date hierarchies, reference date dimension, server date dimension, smart date key, capturing user input for calculated measure, and MDX date functions. I hope that you find this article useful. Date dimension is the most frequently used dimension in data warehousing, hence it is likely that we will come across date dimension (and the subjects we discussed above) when building cubes in SSAS. Thank you for reading.

Vincent Rainardi
Author of Building a Data Warehouse With Examples on SQL Server
January 2009

This is a repost from SQLServerCentral.

Date Dimension in Analysis Services (part 1)

Filed under: Analysis Services,Data Warehousing — Vincent Rainardi @ 9:55 pm
Tags:

In data warehousing, date dimension is the most frequently used dimension. Consequently, when building a cube for a data warehouse in Analysis Services, we almost always have to create a date dimension. In this article I’d like to discuss things that we are likely to come across when creating a date dimension in Analysis Services, such as having several date dimensions and handling unknown rows. I’m going to refer to Analysis Services as SSAS, which stands for SQL Server Analysis Services. In this article I’m referring to SSAS 2005 and SSAS 2008, not SSAS 2000.

Role Play Dimension

In SSAS, we can have the same dimension added into the cube several times as different names. This is known as a ‘role play’ dimension. A dimension that has been attached to a cube is called a ‘cube dimension’.

The purpose of having a role play dimension is to have identical dimensions in the cube. These cube dimensions have the same attributes, the same members, the same hierarchies, the same sorting order, the same properties, the same default member, and the same display folders. Everything is the same, except the name and the relationship to the measure groups in the cube, i.e. referenced or direct, materialized or not.

For example, in retail banking, for checking account cube we could have transaction date dimension and effective date dimension. Both dimensions have date, month, quarter and year attributes. The formats of attributes are the same on both dimensions, for example the date attribute is in ‘dd-mm-yyyy’ format. Both dimensions have members from 1993 to 2010. Both dimensions have Year-Month-Date hierarchy.

When we change something, for example adding 2011 dates, both transaction date dimension and effective date dimension will be affected. This way we can be sure that they will always be identical. On the other hand, if we create the transaction date dimension and effective date dimension from 2 separate date dimensions (say transaction date is from date1 and effective date is from date2) then when we change the date1 dimension (say adding a new level), only transaction date will be affected.

Multiple Named Queries

Data Source View (DSV) is a layer on an Analysis Services project where we can specify the tables and views that we use to build a cube, and the relationship between the tables/views. Instead of specifying a table or a view, we can also specify a SQL select statement that queries a table or a view, or several tables/views. This select statement is called a Named Query.

On the DSV, we can create several named queries from the same date dimension table on the relational database. The reason for doing this is to enable us select a different range of data, i.e. different sets of rows. For example, in a credit card cube, for the start date dimension we may want to select different date range compared to the expiry date dimension. Perhaps the start date starts from 1996 but the end date starts from 1998. For insurance industry, for each policy or risk we have written date, accounted date, inception date, effective date and expiry date. These dates may have different ranges.

The second reason for having separate named queries on the DSV for date dimensions is to enable us to have different sets of columns. For example, for written date, transaction date and effective date the business may need year, quarter, month and date attributes. Where as for snapshot month they only need month and year.

The third reason for having separate named queries in the DSV for date dimensions is to enable us to set different formats for each attribute, as well as different hierarchy structures. Some date dimension may require ‘2008 July’ and ‘2008-Q1’ without any hierarchy but another date dimension may require just the month name and quarter name (e.g. ‘July’ and ‘Q1’) and a hierarchy to connect the two.

Normally for each named query on the DSV we create one dimension. But in some cases we may need to create 2 or more date dimensions from a single named query on the DSV. The reason for this is to enable us to configure the dimension properties differently, such as unknown member, default member, error configuration and display folder. And also, we can specify dimensional security differently.

Before we continue, let’s recap:

  1. From one date dimension table we can create several named queries.
  2. From one named query we can create several dimensions.
  3. From one dimension we can create several cube dimensions.

Unknown member

An ‘unknown row’ is a row on the dimension table to which the orphaned fact rows are assigned. The unknown row usually has a surrogate key value of 0 or -1. For example, the date dimension table contains dates from 1/1/1980 to 12/31/2020. If on the source of the fact table we have a date of 1/1/1970, which is not on the dimension table, the date surrogate key on the fact table is set to 0 (or -1). This way that fact table row is assigned to the unknown row.

In some data warehouses, the unknown row for the date dimension is 1/1/1900. Consequently, the year column of this unknown row is set to ‘1900’. Some users don’t like to see ‘1900’ when browsing the cube. They prefer to see ‘unknown’ instead of ‘1900’. But year is a numeric column and we can’t store the word ‘unknown’ in the year column. In this case we may choose not to use the unknown row but to map it to the dimension unknown member. To do this, we make the unknown member of the date dimension ‘visible’. On the DSV, we explicitly exclude the unknown row like this: “select … from dim_date where date_key <> 0”. On the error configuration of the cube, we set the KeyErrorAction to ‘ConvertToUnknown’, the KeyErrorLimitAction to StopLogging and the KeyNotFound to IgnoreError. This way, when SSAS processes the cube and found a date on the fact table that does not exist in the date dimension table, that fact row will be assigned to the unknown member and SSAS will continue processing the cube. We need to be careful when doing this because it will affect all other dimensions, not just the date dimension.

There are 3 places where error configuration for the orphaned fact row can be set: cube, measure group and partition. The error configuration on the dimension itself doesn’t affect the orphaned fact row; it is for orphaned dimension rows in a snow flake schema situation.

Another benefit of using the unknown member rather than the unknown row is to capture ‘orphaned rows’. An orphaned row is a row on the fact table with a dimension key that does not exist on the dimension table. In best practice this should not happen. The ETL is supposed to prevent this situation. The ETL should allocate key 0 (or whatever the surrogate key of the unknown row is) to those fact table rows, so that they are mapped to the dimension unknown row. But in reality this does happen in practice. Not intentionally of course but it does happen. A typical situation is where the dimensional key column on the fact table contains NULL rather than 0 because that key column is not applicable for that fact row.

We suppose to have a foreign key on the fact table to prevent orphaned rows, but in many data warehouse implementation I found that this is not the case. Some people argued that “it is not possible to have orphaned rows on the fact tables”, because “all data flowing into the warehouse is controlled by the ETL” and “the ETL always mapped unknown fact rows to the unknown row in the dimensions” so “we don’t need to put foreign keys”. But I found in a few occasions that data warehouses without foreign keys on the fact tables do have orphaned fact rows. In chapter 6 of my book Building a Data Warehouse With Examples on SQL Server, I explained the benefits of putting foreign keys on the fact tables and how to deal with the assumed disadvantages (such as slowing ETL load process).

In data warehousing and business intelligence, mapping orphaned fact rows to the unknown member is important because if not we will miss those fact rows, causing the total of measures to be incorrect. In SSAS, if we don’t change the UnknownMember and ErrorConfiguration properties, by default orphaned rows on the fact table will be mapped to the dimension unknown member. This way we will always get the correct totals of the measures. Some people set the UnknownMember property of the dimension to ‘Hidden’, relying completely to the ETL to guarantee that there are no orphaned rows in the fact table. If you decide to do this, it is wise to put foreign keys on the fact tables to guarantee referential integrity.

Another benefit of using unknown member rather than unknown row is that we can specify the name of the unknown member. It doesn’t have to be ‘Unknown’. We can set it to ‘Not Applicable’, for example, to suit the users’ needs.

Despite all the advantages I mentioned above, personally I would prefer not to fiddle around with the unknown member in SSAS. Rather, I prefer to set the data in the fact and dimension tables correctly and leave the SSAS UnknownMember as per their defaults. For example, I’ve come across a situation where the value of an attribute on the unknown row is = ‘unk’. But there is another row in the dimension table with the attribute value = ‘unknown’. When browsing the cube the users will find that the attribute has both ‘unk’ and ‘unknown’ members. We could tackle this on the DSV by adding a ‘CASE WHEN’ clause on the named query SQL, or we could exclude the unknown row and use the unknown member instead. But I prefer to fix the data, setting the physical values of that attribute correctly in the dimension table. The physical dimension table may not only be used by SSAS; it may also be used for reporting by SSRS or other reporting/BI tools such as Business Objects or Cognos.

Another disadvantage of using unknown member rather than unknown row is that when we make the unknown member visible, when there is no unmatched record, we will still see that member (unless we suppress it on the OLAP client).

Date Hierarchies

It is a best practice to build a hierarchy and hide the composing attributes. This is more so in 2008 where AS checks if we have hidden the members used in the hierarchy and give us a warning if we haven’t done so, e.g. “Avoid visible attribute hierarchies for attributes used as levels in user-defined hierarchies”.

For example, say we have these attributes: date, quarter, month and year.

  1. Year: yyyy, e.g. 2008
  2. Quarter: yyyy Qn, e.g. 2008 Q4
  3. Month: yyyy-mm, e.g. 2008-10
  4. Date: yyyy-mm-dd, e.g. 2008-11-15

We then create a Year-Quarter-Month-Date hierarchy and we hide the Date, Month and Year attributes. When we browse the hierarchy using ProClarity it looks like this:

Figure 1. Browsing a date hierarchy in ProClarity

And in Excel 2007 it looks like this:

Figure 2. Browsing a date hierarchy using Excel 2007

My colleague John Tunnicliffe advised me about ISO 8601 date format (yyyy-mm-dd), which I think is a good idea because of its clarity. It takes away the confusion caused by country-by-country custom such as dd/mm or mm/dd. He also mentioned about dd-mmm-yyyy format, e.g. 06 May 2008, which is useful to remove the confusion about month, such as 05/06/08: is it 5th June or 6th May? One caution about using mmm (short form of month) is the language, i.e. is it Mei, Mai or Mayo?

On the OLAP client, users can select members from different levels. And those members are not necessarily ascendant to each other. For example, users can still select non-ascendant months together, user can still choose ‘all dates in July 2008’. This depends on the OLAP client, i.e. some OLAP clients provide facility to select all descendants of a member, but some with OLAP clients we have to select the descendants manually.

Although BIDS 2008 advised to hide the attributes used in the hierarchy, in my experience some users would still prefer to see those attributes. This enables them to use (for example) the month attribute directly either as a slicer or filter, without navigating through the Year-Month-Date hierarchy.

We should name our hierarchies properly. The name needs to reflect the levels, i.e. ‘Year-Month-Date’, not just ‘Date Hierarchy’. Also it is better to avoid abbreviation. Calling it YMD might cause confusion among some users, wondering what YMD stands for.

It must have been quite a long read so far, so I’ll end it here. In part two I will discuss:

  1. Date dimension that is used as a referenced dimension
  2. Date dimension that is generated and stored on the SSAS server (no physical table)
  3. Advantages and disadvantages of using smart date key e.g. YYYYMMDD with int data type
  4. Enabling users to select a date (or month) to be used in calculated measure using ‘from date’ and ‘to date’
  5. and other things

Vincent Rainardi
Author of Building a Data Warehouse With Examples on SQL Server
November 2008

Part 2 of this article is here. This is a repost from SQLServerCentral.

Class does not support aggregation

Filed under: SQL Server — Vincent Rainardi @ 4:51 pm
Tags:

I experienced this error message: “Message: Class does not support aggregation (or class object is remote) (Exception from HRESULT: 0x80040110 (CLASS_E_NOAGGREGATION))”

When: this message appear when I tried to open an SSMS solution. In this case it’s a SQL Script solution (relational).

Env: XP SP3, SQL 2k8 RTM

Background: A few days ago I uninstalled a lot of VS2005 stuff and SQL2005 stuff from Control Panel (as I’m using VS2008 and SQL2008)

Solution:

  • I went to Control Panel and clicked remove/change on SQL Server 2008, selected remove, selected Management Tools basic and advanced and removed them.
  • Then I clicked remove/change again on SQL Server 2008 on Control Panel, selected add, selected Management Tools basic and advanced (and I also select SSIS and SSRS and Sync — I didn’t know I must have uninstalled them unintentionally) and added them back.

After that I can open the solution without any problem, just like last week.

15 December 2009

Building Cubes from Transaction Systems – Creating a dimension from a large table

Filed under: Analysis Services — Vincent Rainardi @ 7:02 am
Tags:

At SQLBits last month I presented a session about building cubes from transaction systems. Presentation slides are here. I’m going to write some of the points from that session as blog posts.

One of the primary challenges of building cubes from a transaction system is that we don’t have nice small dimension tables. Sometimes we need to create a dimension from a large table, say 100 million rows. When we do this, if we use the primary key of the large table, the DSV query will have the same grain as the large table and we will end up with 100 million rows in our DSV query:
select pk as dim_key, attribute1, attribute2 from large_table

Dimension processing will be a lot quicker if we select distinct those attribute, and use their concatenation as the dim key:
select distinct attribute1 + attribute2 as dim_key, attribute1, attribute2 from large_table

This way the dimension will only contain the crossjoin of attribute1 & attribute2 (say 10,000 rows) rather than 100 million rows. The query will be even faster if attribute1 & 2 are included in a covering index.

Some notes when doing this:

  1. NULL + ‘a’ = NULL, so convert NULL to blank string like this: isnull(attribute1,’’)
  2. Use |, ~ or ¬ to separate attributes for clarity
  3. Trim the attributes on the dim key. Dim key is also on the fact table and fact table is usually a large table so we want its columns to be slim.

So the query becomes:
select distinct isnull(rtrim(attribute1),’’) + ‘|’ + isnull(rtrim(attribute2),’’) as dim_key,
attribute1, attribute2 from large_table

On the fact table SQL we produce the same dim key, by joining on the PK of the large table:
select …, isnull(rtrim(attribute1),’’) + ‘|’ + isnull(rtrim(attribute2),’’) as dim_key
from trans_table A
left join large_table B on A.fk = B.pk

But that’s joining a large table with a large table and it’s going to be slow! Yes but:
a) We can partition the measure group so the query is not so slow. Whereas on the dimension we can’t partition it.
b) SSAS put select distinct around the dimension query. A select distinct on 100 million takes a while. Whereas the partition query is a straight forward query (no select distinct around it).
c) In the case A & B being master-child trans tables (like order header & order detail), both tables are indexed on the PK-FK columns (order ID) so the join is efficient.

I found that overall it is quicker to put the big query on the measure group compared to putting it on the dimension.

SSAS Quick Tips

Filed under: Analysis Services — Vincent Rainardi @ 6:58 am
Tags:

Just a very quick post today: if the property is a drop down list, instead of selecting from drop down list, we can double click the property name to change its value:

This is not useful if the drop list has a lot of values, but it’s handy when they have only 2 or 3 values. Like true false properties for example. AttributeHierarchyEnabled, AttributeHierarchyVisible, etc.

I’m sure that some us know this already, but not all of us. So I hope it’s worth sharing small details like this. If it’s worthed it, please let me know (vrainardi@gmail.com, or via comment), as I have a few more. For example, on the cube structure tab of cube design, if we want to change many measures in one go, we can switch to Measure Grid view. Click on that white 3 columns button. (Click the button, not the drop down arrow, saves us a click).

Then select several measures by pressing control while clicking.

And change the measures property.

Handy when we have many measure to change in 1 go. I used it often for changing MeasureExpression, DisplayFolder and FormatString for a new cube. If it’s too many and they different a little bit, I use AMO to update them. For example, updating MeasuresExpression for 200 measures, or creating 200 calculated measures.

Copy a Table

Filed under: SQL Server — Vincent Rainardi @ 5:05 am
Tags:

At times we need to copy a table, with all the data in it, from one SQL Server database to another. There several ways to do this:

  1. Select Into
  2. SSMS Import/Export Wizard
  3. SSIS Transfer Object task

Select Into

select * into table1 from [server1].database1.schema1.table1

This statement creates an empty table with identical structure and populates it by copying data from the source table. Even if the table has an identity column it still works. We can specify a where clause to copy only part of the table.

Notes:

  1. We may need to create a linked server if the source is on another SQL Server instance.
  2. If the table already exists in the target database, you need to drop it first. You could add this into the script: “if exists (select * from sys.tables where name = ‘table1’) drop table table1”.
  3. We could also script the table (right click the table name on object explorer and select “script table as”) and then do “insert into select from“. This way, if the target table has identity column: switch off identity insert, insert data (with column names), switch identity insert back on.

SSMS Import/Export Wizard

Right click the database name containing the table you want to copy, and select Task, Export data. On the Import Export Wizard specify the source database, target database and source table(s) that you want to copy. At the end of the wizard the table(s) will be copied across.

Notes:

  1. We can specify the mapping between source and target columns.
  2. We can copy just part of the table by specifying the where clause on the query.
  3. We can save it as SSIS package for later run or scheduled run.
  4. Destination table will be created. If it already exists, it will append the rows (not replace).

SSIS Transfer Object task

On BIDS create a new SSIS project. Create Transfer SQL Server Object task on the Control Flow. Double click the task and specify the source database, destination database, and the table(s) you want to copy. Also specify whether to drop the table if already exists, whether to copy the data, indexes, PK, FK, etc. Then press F5 to execute it (or right click on the task and select execute).

As always, there are pluses & minuses on each one: select into or script then insert is simple and quick but the work is manual. Using the Export wizard it’s more effortless, we can schedule it and we can copy more than 1 table, but can’t replace row/truncate first. Using SSIS we can copy several tables, and we can truncate/replace data but we can’t specify a query to copy partially.

As always, which one to use depends on our situation, see considerations above. But if I had to choose one for general situation, I would use SSIS Transfer Object task.

PS.

The term ‘copy a table’ is not the term that is used in database professional. In the database world, ‘copy’ is not a verb that is associated with a table. A table is created and dropped. We insert data into a table and delete rows from a table. But copy is not associated with a table. But, oddly enough, ‘copy a table’ is the term that people not from database background use. To them, a table can be copied. A table can be deleted (not dropped).

Ironically, Oracle, MySQL and DB2 people are more used to the term ‘copy a table’. Unlike in SQL Server world, they have a concept of copying a table. In Oracle, we have ‘create table table1 as select * from table2‘. In MySQL we have ‘create table table1 like table2’. In DB2 Control Center we have copy table window to create a copy of a table. In my opinion, in SQL Server, in Object Explorer, if we right click on a table, next to Rename and Delete we should see Copy. In the next version I mean (hint hint).

Next Page »

Blog at WordPress.com.